Tackling Economics Multiple Choice Questions; Short and Sweet
The third and final type of question you’ll come across are multiple choice questions. These are all weighted at 1 mark each, and will pop up at the start of most of your exams. The MCQ is the section where you really shouldn’t be dropping ANY marks.
There isn’t as much technique for multiple choice questions, but there are few tips and tricks you can use to do well. There really is only ONE strategy for you to ace the multiple choice section; practice.


As you get closer and closer to your exams, you should really be practicing sets of MCQ every day. As you do this, your accuracy will improve and the amount of time you spend will drastically decrease. Exposure is your best friend here, so attempting as many DIFFERENT trial papers as possible will help you so much.
Similar to SAQs, you should look back on summary notes if you’re lost answering MCQs. MCQs tend to be more calculation based and similar to SAQs will be very focused on the application of content to different scenarios (these tend to be hypothetical).
To give you an idea of some key techniques with year 11 multiple choice questions, I deconstructed a few from each topic below:
Topic 1 Introduction to Economics
Example Question One:


2019 North Sydney Girls Yearly
An outward shift in the production possibility curve, from P1P1 to P2P2, can be caused by:
- Discovery of new technology
- Discovery of new resources
- Increased productivity
Thus the correct answer in this case would be either (B) or (C). This is where an important exam technique comes into play; choosing the most correct answer.
- (B) directly satisfies the conditions mentioned above so it sounds like a pretty good choice
- (C) could lead to an increase in labour resources, but we can’t assume that the increase in population will directly increase the size of the labour force (as they may not want to / be able to participate in the labour force)
Therefore, we choose (B) since it is the most correct answer.
Example Question Two:


2019 North Sydney Girls Yearly
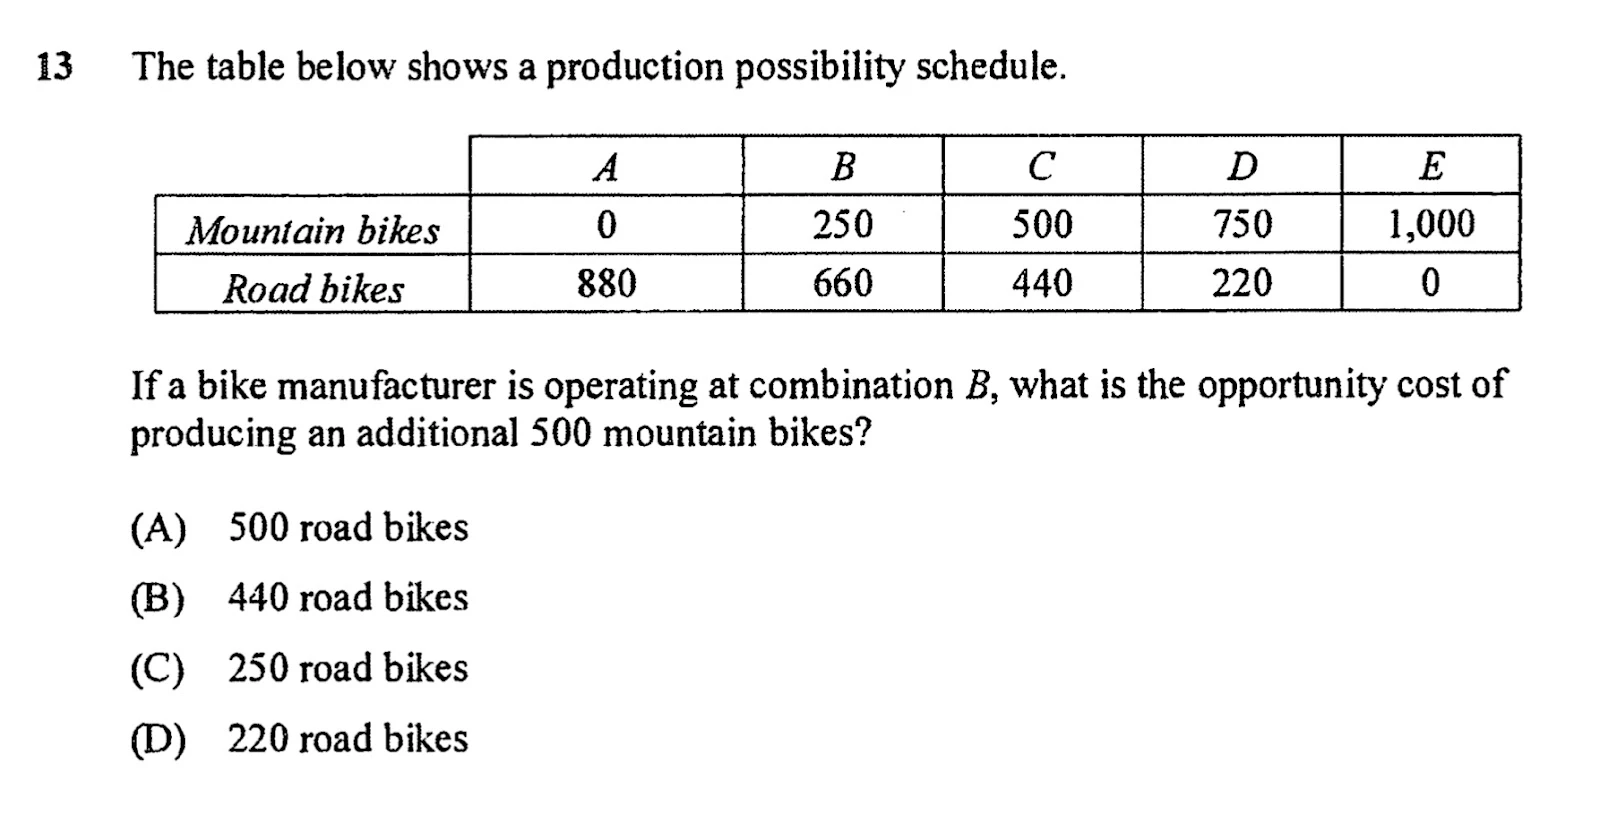
This one’s a simple calculation question! Most students lose marks in simple calcs. You’ve just gotta make sure you know your formulas and you’ll be good! In this case, the formula you need is:
Opportunity Cost = Benefit Forgone / Benefit Gained
- Let’s apply it here:
- If we decide to produce an additional 500 mountain bikes, we are moving from point A to point C
- This means we LOSE the production of 440 road bikes (880-440)
- Thus, the correct answer would be (B)
Example Question Three:


2012 North Sydney Girls Assessment Task 1
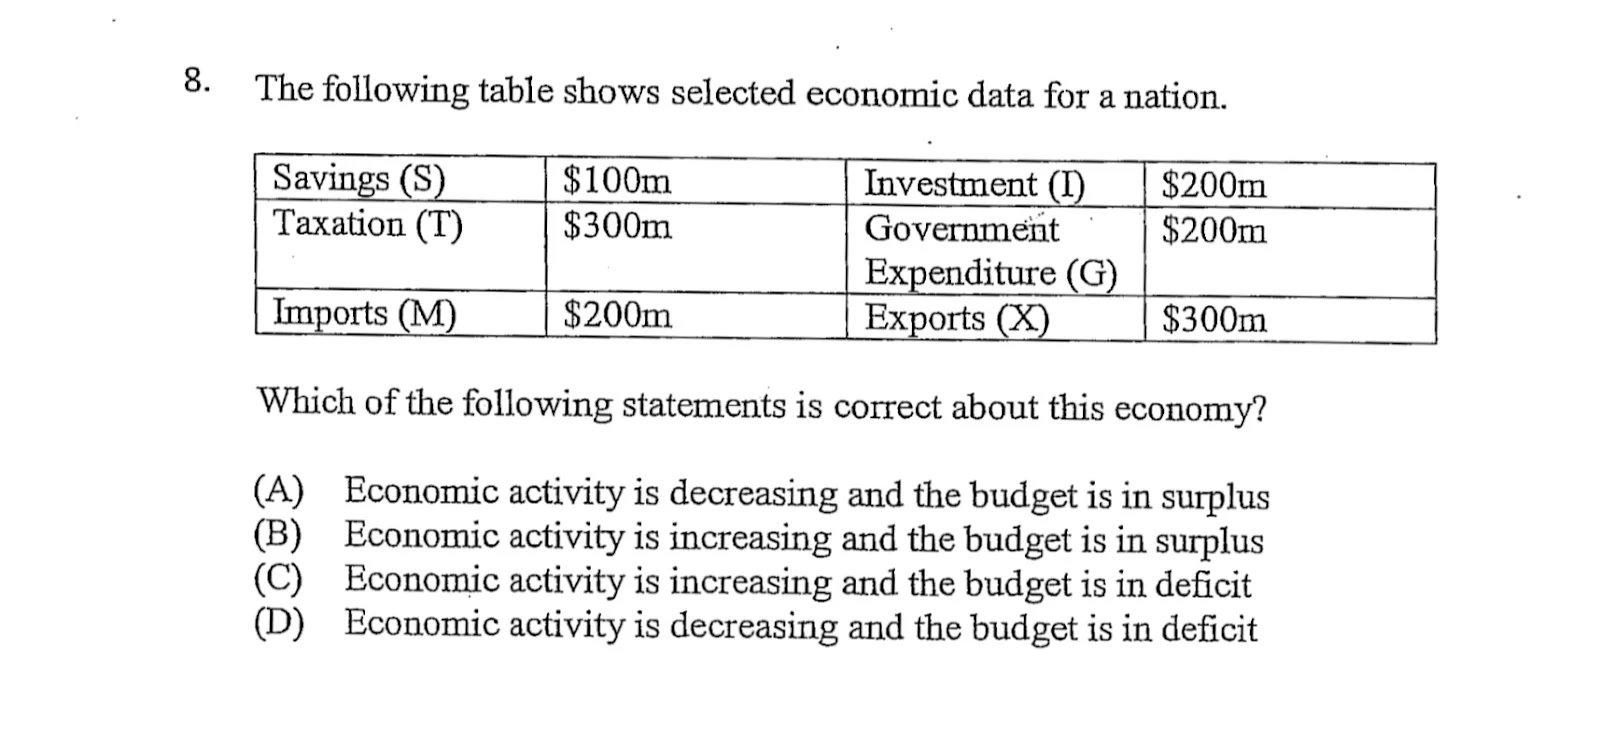
This question brings up a few important formulas for year 11; the injections, leakages and budget balances. Their equations are:
Injections = I + G + X
Leakages = S + T +M
Budget Balance = T-G
- Now let’s input the values given:
Injections = $200m + $200m + $300m = $700m
Leakages = $100m + $200m + $300m = $600m
Budget Balance = $300m - $200m = +$100m = $100m Budget Surplus
- We now need to compare injections and leakages to determine the economy’s current state:
$600m =Leakages < Injections = $700m
Economic State
Conditions
- Equilibrium
- Leakages = Injections
- Disequilibrium; Economic activity is increasing
- Leakages < Injections
- Disequilibrium; Economic activity is decreasing
- Leakages > Injections
- Thus, given our calculations we can say that economic activity is increasing and the budget is in surplus, giving the correct answer as (B)
Topic 2 Consumers and Business
Example Question One:


2019 North Sydney Girls Yearly
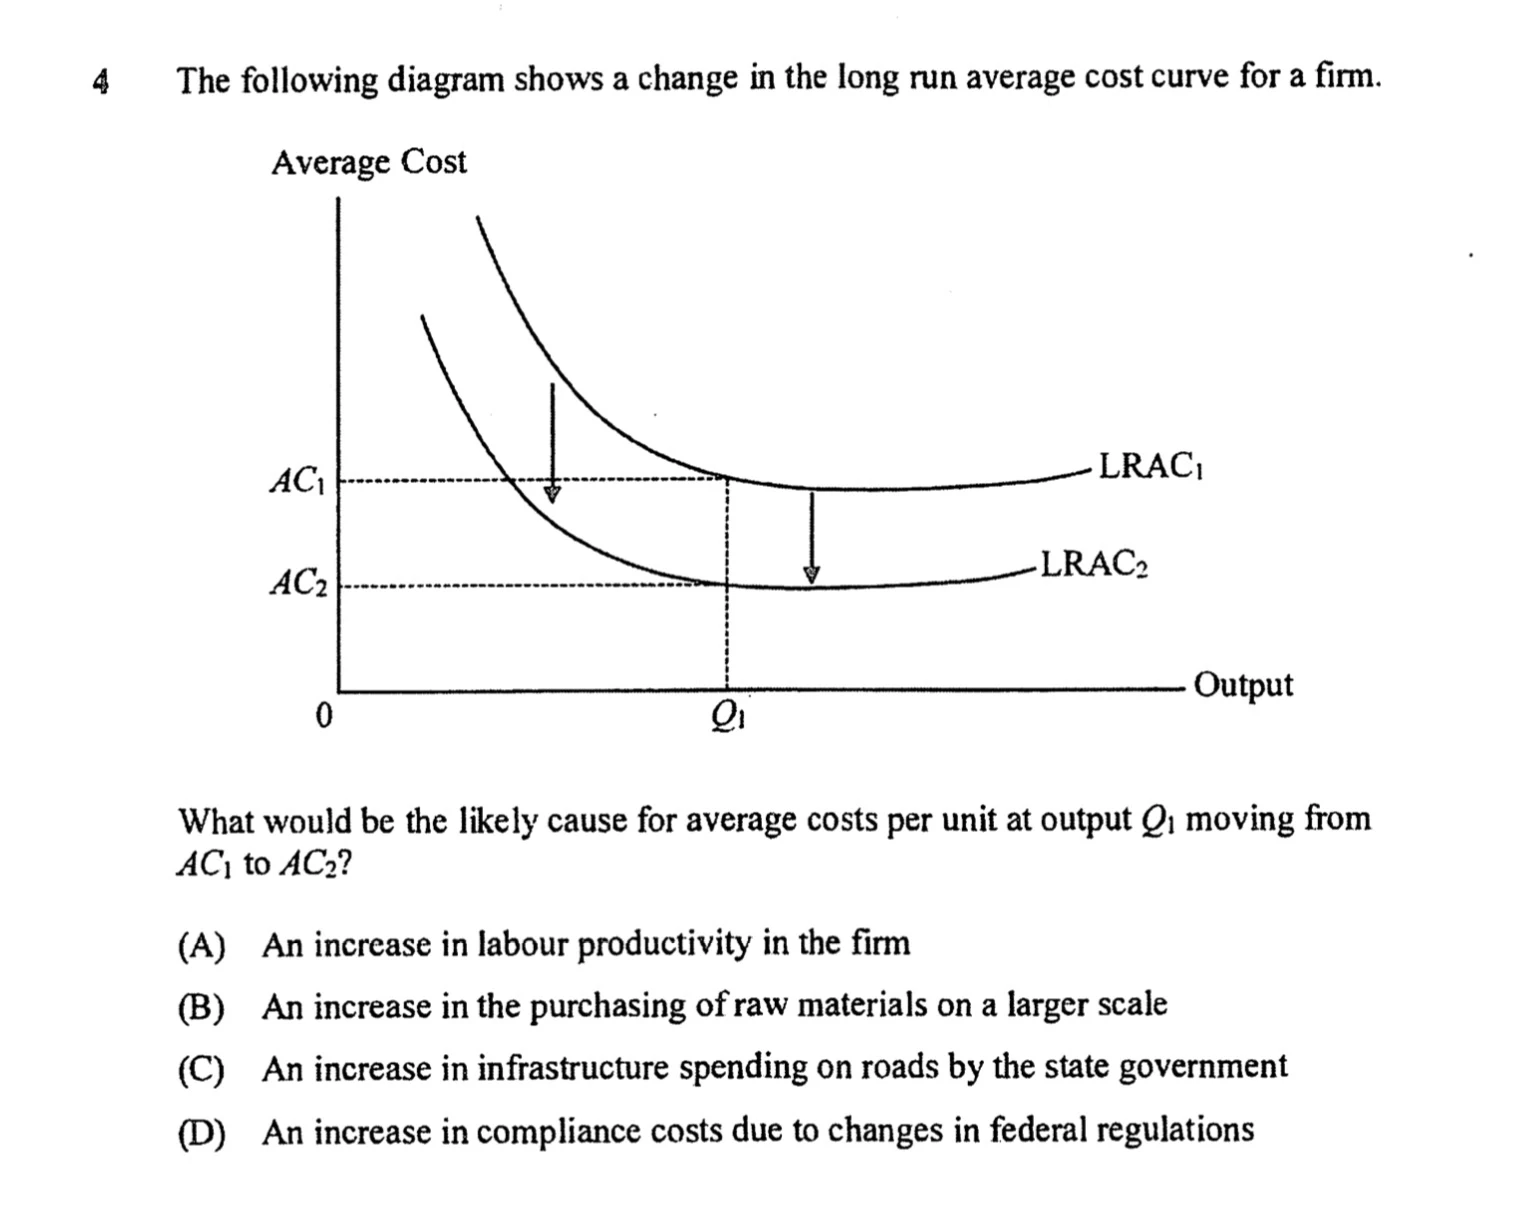
A downward shift in the LRAC curve is also known as an external economies of scale; when a factor outside the firm’s direct control will decrease the average costs of goods or services produced. Let’s look at each answer option:
- Since the increase in productivity is specific to the firm, it would indicate that this factor is inside the firm’s control, and is this an internal economies of scale
- The purchase of raw materials in bulk is again specific to the firm; i.e. it’s their choice to make that production decision. This makes (B) an internal economies of scale
- Any contribution from the government is outside the firm’s control, and in this case more spending on roads could help reduce traffic congestion and lower the time and costs associated with transports. This makes (C) an external economies of scale
- Likewise, (D) is also out of the firm’s control making it an external factor. However, the increase in compliance costs will increase average costs, making this option an external diseconomies of scale
Thus, the correct answer is (C)
Example Question Two:


2019 North Sydney Girls Yearly
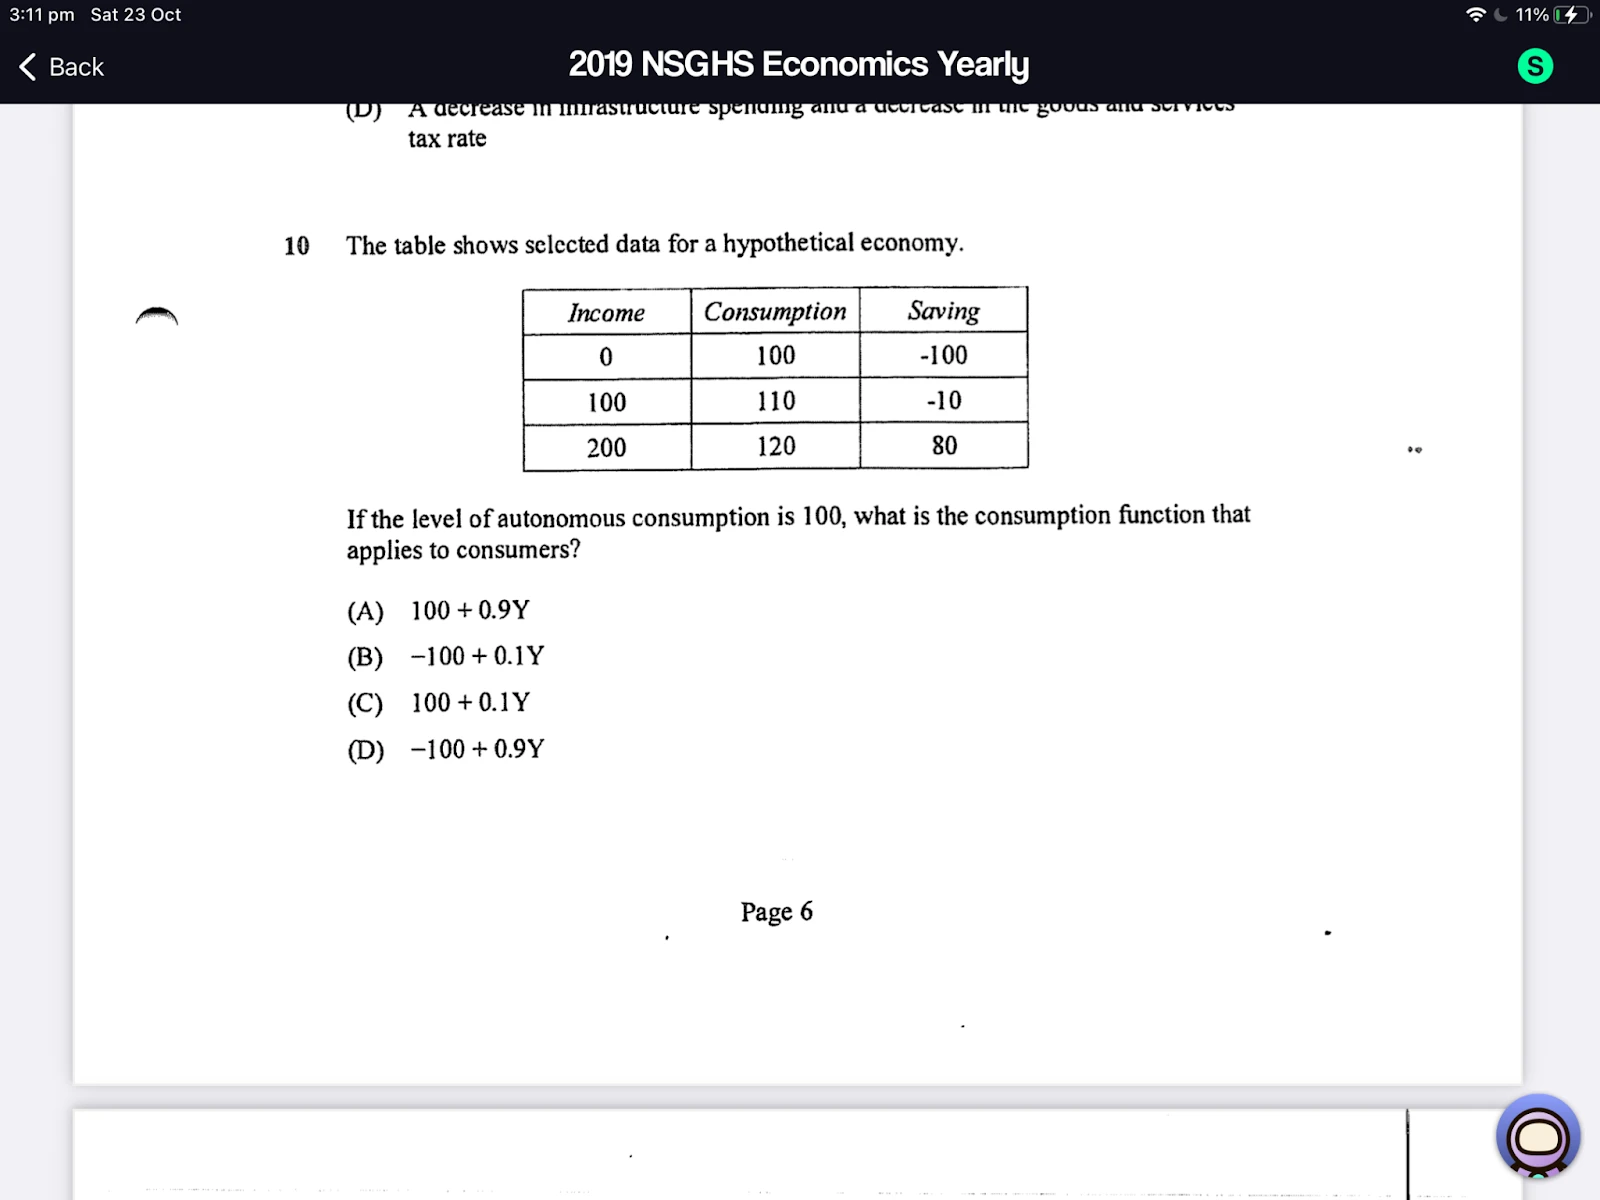
Another calculator question! This time the formula we need to use is:
C = aC + MPC*Y
- aC refers to the level of autonomous consumption, which is given to us as 100
- MPC is the marginal propensity to consumer, which can be calculated as:
MPC = C/Y
- Using values from the table, we can calculate MPC as:
MPC = (110 - 100)/100 - 0 = 0.1
- Now we can insert these values into the consumption function to give:
C = 100 + 0.1*Y
Thus, the correct answer is (C)
Example Question Three:


2013 Knox Grammar Economics Yearly
This multiple choice question requires you to know the definition of consumer sovereignty; that is the controlling power that a consumer has in determining production decisions based on consumption patterns. Now we need to go through each answer option, and describe whether consumer ‘controlling power’ has increased or decreased:
- Persuasive advertising is a way that firms can manipulate them into purchasing certain products over others, which directly reduces consumer sovereignty
- A highly competitive market would mean that it is hard for firms to gain adequate market share. They will therefore rely on consumption decisions to alter their production patterns, increasing consumer sovereignty
- Likewise, excessive demand for a good will cause firms to produce more of it, increasing consumer sovereignty
- A market-based economy is defined as one where the market forces of supply and demand (by consumers) determines production decisions. Moving to this type of economy would therefore increase consumer sovereignty
Thus, the correct answer is (A)
Topic 3 Markets
Example Question One:
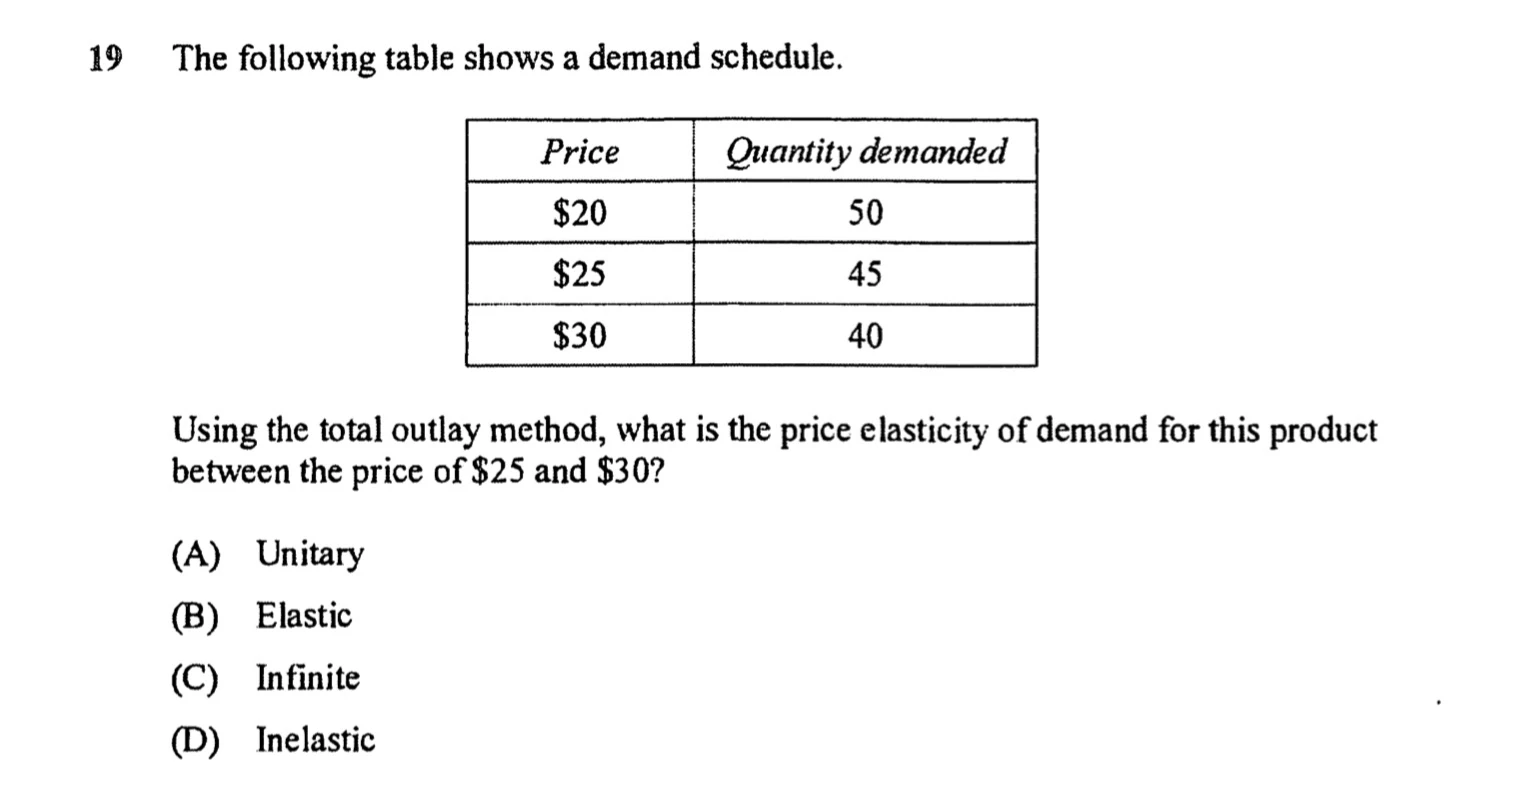


2019 North Sydney Girls Yearly
Let’s start topic 3 off with a calculation question! The formula required is:
Total outlay = Price * Quantity
- In this case, we need to use the total outlay method between a price of $25 and $30, which gives:
Total outlay(1) = $25*45 = $1125
Total outlay(2) = $30*40 = $1200
- The total outlay method also requires an understanding of what’s happening between the two points. In simple terms:
Price Elasticity
Movement of Total Outlay relative to Price
Relatively elastic
- Price changes cause total outlay to move in the OPPOSITE direction
Relatively inelastic
Price changes cause total outlay to move in the SAME direction
Unit elastic
Price changes cause total outlay to remain CONSTANT
- In this case, as price increases (from $25 to $30), total outlay also increases ($1125 to $1200). According to our table this means that the price elasticity of demand is inelastic.
Thus, the correct answer is (D)
Example Question Two:
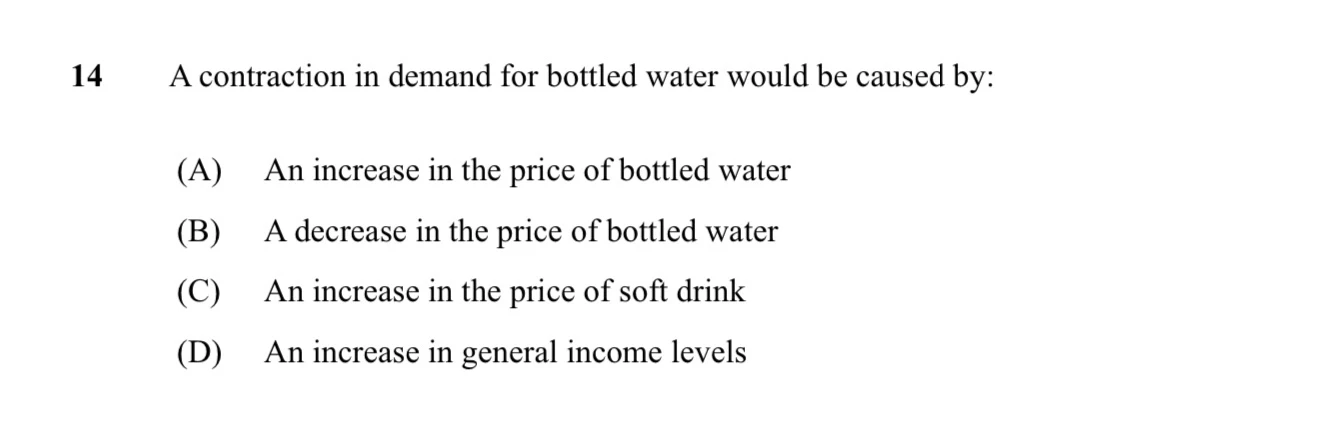


2014 Knox Grammar Yearly
This one’s an excellent example of an application-based question. The syllabus teaches us that the demand for a good is controlled by:
- The price of that good
- The level of income available to purchase that good
- The population who can purchase that good
- Consumer tastes and preferences for that good
- The prices of substitute goods
- The prices of complementary goods
- Expectations of changes to the price of that good in the future
Now that we know where this question is taken from in the syllabus, let’s determine which situation would lead to a contraction in demand. However, we also need to remember that a contraction in demand is when there is a decrease in quantity demanded that can ONLY be caused by an increase in the price of that good. This means we can save time, and just look for the answer option which indicates that there is an increase in the price of bottled water.
Thus, the correct answer is (A).
Example Question Three:
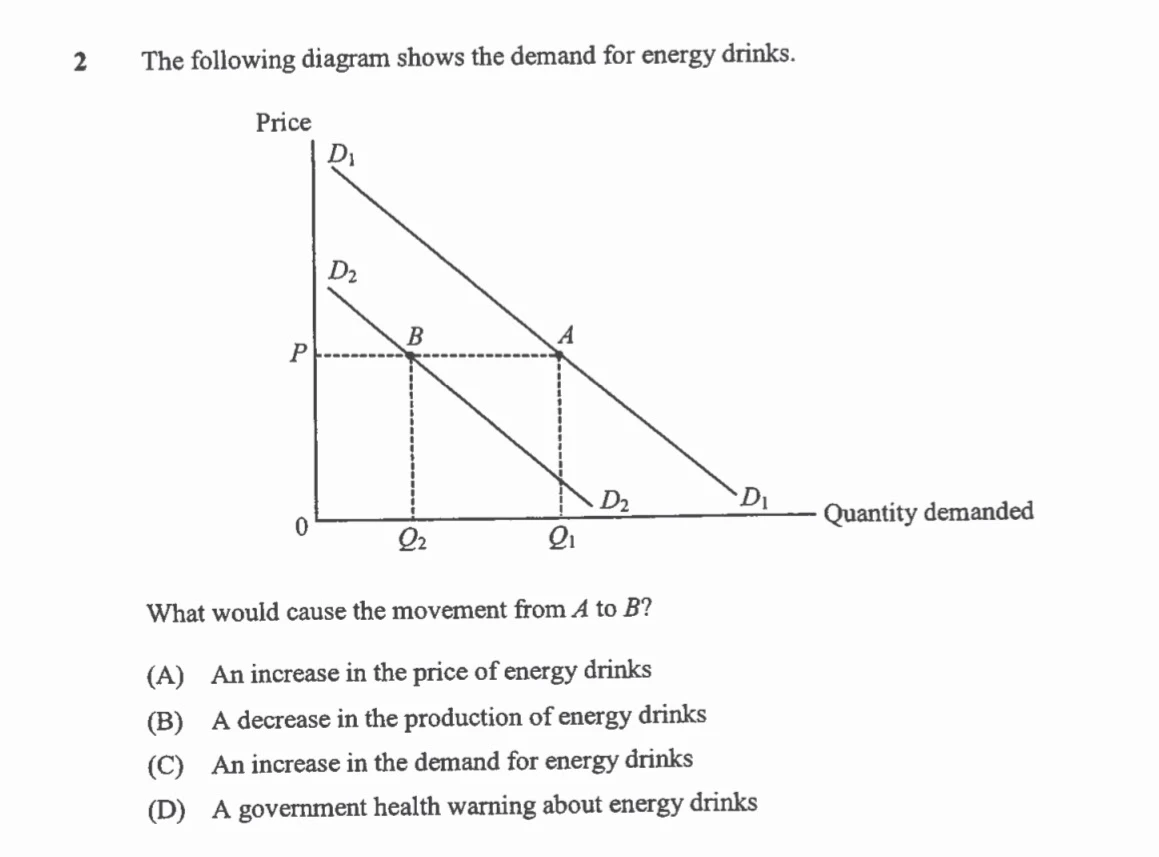


2014 Normanhurst Boys High School Yearly
Let’s look at a similar question. In this case, there is a decrease in demand indicated by a leftward shift in the demand curve (from D1 to D2). We must note that the price is fixed (at P) during this shift, thus we need to look for an option that describes why demand for energy drinks would decrease regardless of its change in price.
-
An increase in the price of energy drinks would reduce the total quantity demanded by consumers, and leads to a contraction in demand
-
Note this is wrong since we are NOT looking for any price change in energy drinks
-
A decrease in the production of energy drinks is a supply-side factor, which leads to a decrease in supply
-
This option is the exact opposite for what we are looking for, so we can disregard it
-
A government health warning about energy drinks would result in less demand from consumers (at a fixed price), which causes a decrease in demand
Example Question Four:
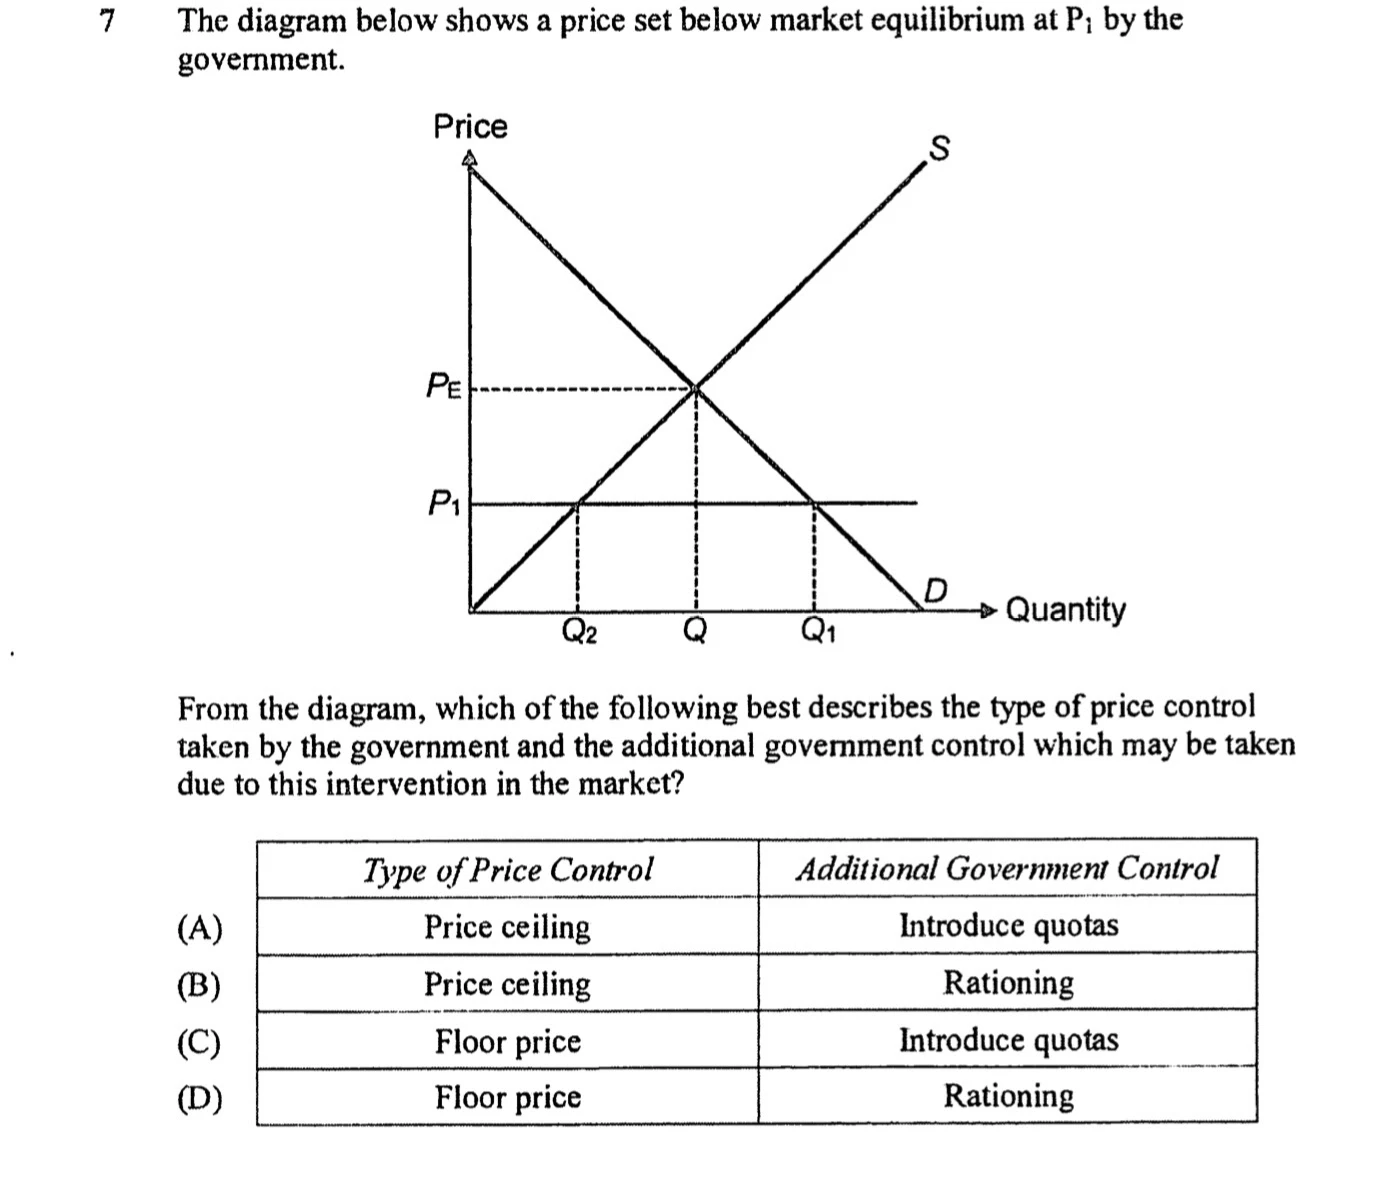


2019 North Sydney Girls High School Yearly
Let’s apply some more content with another diagram question! In this case we need to be looking at syllabus content regarding the role of the government in the market.
From the graph, the government has established a price control (P1) that is lower than equilibrium (PE).
- This indicates that the government thinks the equilibrium price (PE) is too high, and thus chose to implement a price ceiling to push the price down to P1.
- However, by doing so there is now disequilibrium in the market; where there is an excess of demand (D > S). In order to ensure more equality in the market, the government can further implement rationing to share the supply equal across the total demand in the market.
- A good example of this is when sneaker raffles only allow 1 entry per account, and then rations out the product based on a chance raffle (although people still buy accounts and bot sneaker releases to increase their chances)
Thus, the correct answer is (B)
Topic 4 Labour Markets
Let’s go more in depth now and talk about a specific market; the labour market.
Example Question One:
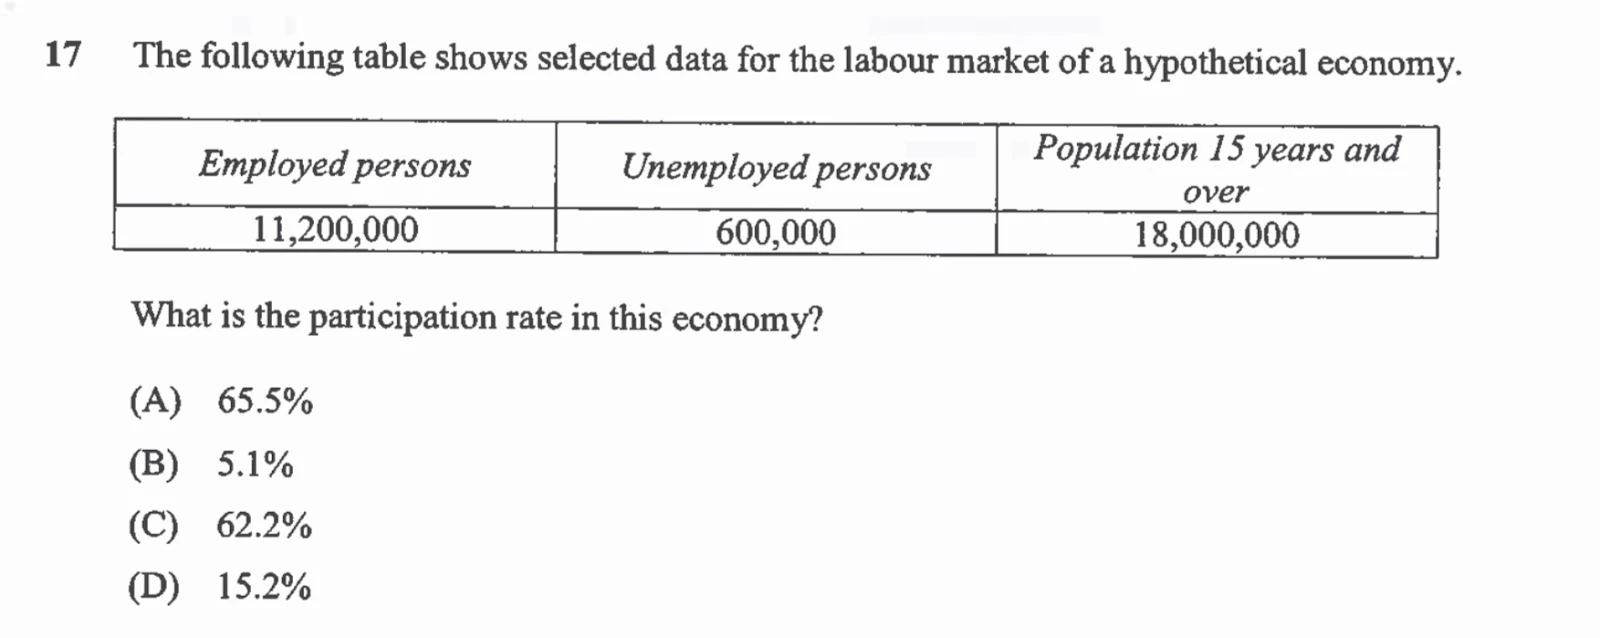


2014 Normanhurst Boys High School Yearly
Again, let’s start off simple with a calculation one. The formula required is:
Participation Rate = Size of Labour ForceWorking Age Population100
Labour Force = Unemployed persons + Employed persons
- Now let’s input our values:
Labour Force = 600,000 + 11,200,00 = 11,800,00
Participation Rate = 11,800,00018,000,000100 = 65.5%
Thus, the correct answer is (A)
Example Question Two:
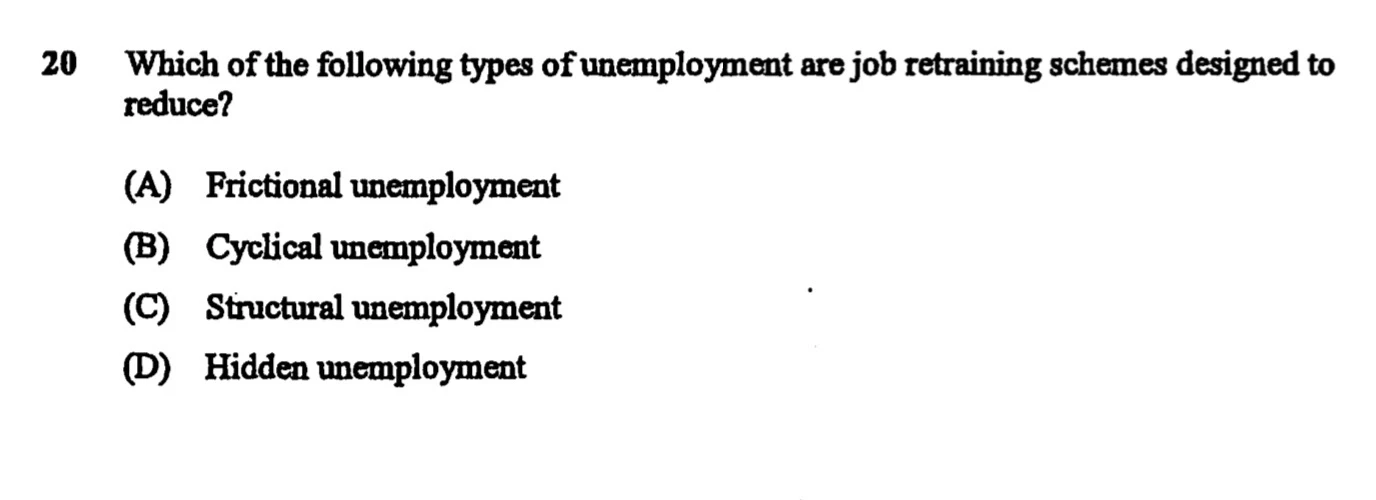


2017 North Sydney Girls High School Yearly
Now let’s test our knowledge on the types of unemployment. This question is a great example that shows you need to know the definition of each type of unemployment, but also be able to understand how we can reduce them. Let’s start by defining each:
- Frictional unemployment is caused by people that are temporarily jobless as they change their occupation or move from one firm to another
- Cyclical unemployment occurs when there is a contraction in economic activity, which reduces the derived demand for labour
- Structural unemployment is caused by a mismatch in skills offered by potential employees and those wanted by employers
- Hidden unemployment refers to unemployment that is not counted in official unemployment statistics, as they have been discouraged from seeking work
Now with the definitions in mind, it makes sense that job retraining schemes (specifically in skills wanted by employers) would reduce the mismatch of skills that causes structural unemployment.
Thus, the correct answer is C
Example Question Three:
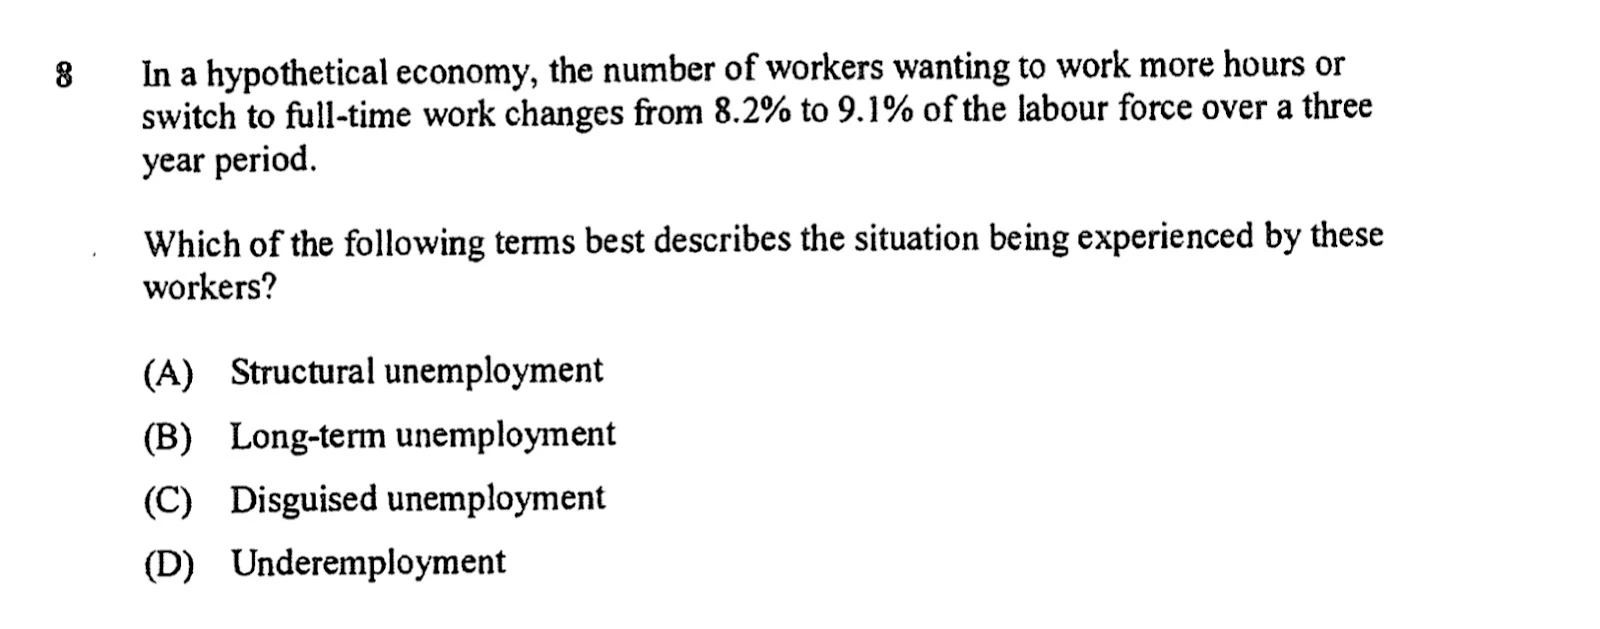


2019 North Sydney Girls High School Yearly
We need to rely on our syllabus definitions for this question as well. According to the context given, there is an increase (8.2% to 9.1%) in the number of workers wanting to work more hours (or switch to full time); this is known as underemployment.
Thus, the correct answer is D
Example Question Four:


2011 North Sydney Girls High School Yearly
This question focuses on the syllabus dot point related to factors affecting demand. We need to remember the demand for labour is controlled by firms. Let’s discuss each option given:
- The productivity of labour would directly relate to the demand for labour, since firms will hire more productive workers to increase profit margins
- The workforce participation rate would alter the supply of labour, since it indicates the percentage of the working age population willing to work
- This option relates to the geographic mobility, which again indicates the available number of potential employees in certain locations; influencing the supply of labour
- Remuneration is another way of saying pay, which again will influence the number of potential employees willing to work in a remote mining town; influencing the supply of labour
Thus, the correct answer is A
Topic 5 Financial Markets
Example Question One:
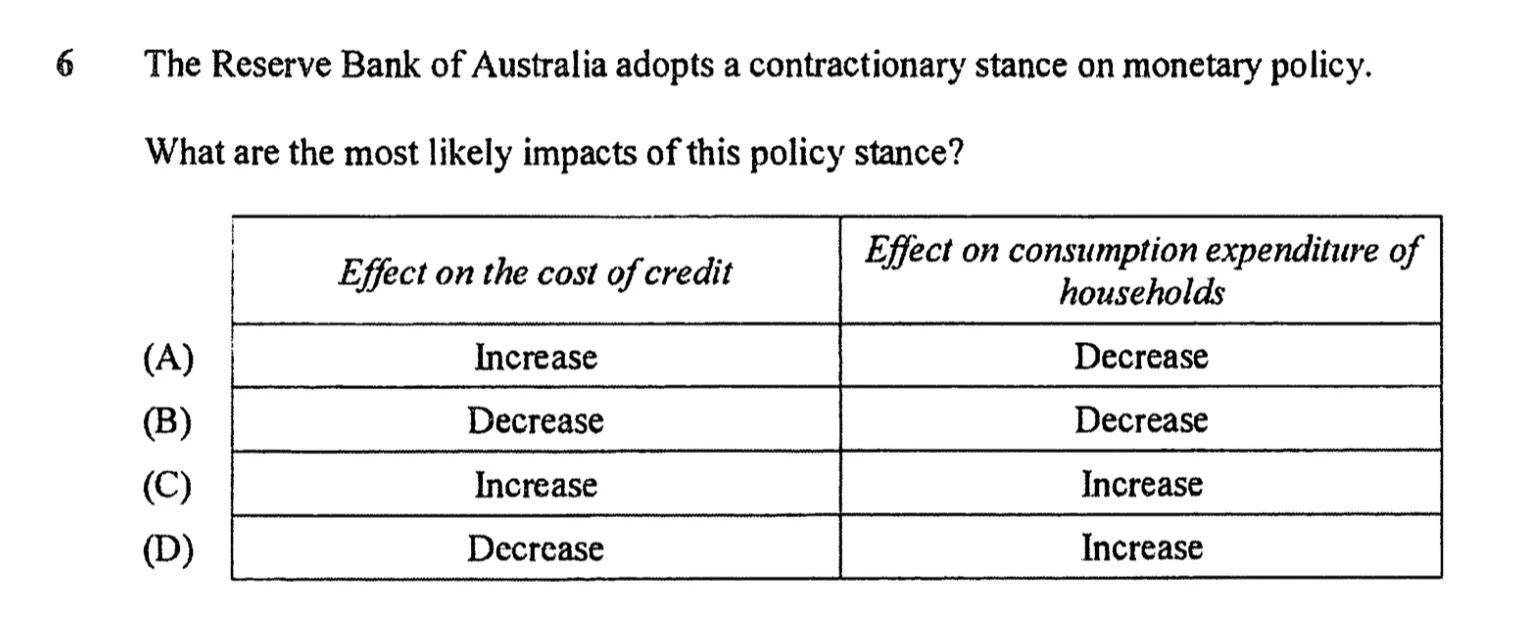


2019 North Sydney Girls High School Yearly
This first multiple choice question in financial markets is not only common in year 11, but also in year 12! Let’s start off with a definition of contractionary monetary policy - an increase in the cash rate facilitated by the RBA in order to reduce economic activity.
-
The increase in the cash rate would directly increase interest rates in the economy, leading to a higher cost of credit (the cost to borrow money)
-
From this we can cross out (B) and (D) as potential options, leaving (A) and (C)
-
A higher interest rate would lead to lower consumption expenditure as households are disincentives fromm borrowing due to higher costs
-
From the remaining options, (A) and (C), only (A) gives the correct effect on consumption expenditure
Thus, the correct answer is (A)
Example Question Two:


2019 North Sydney Girls High School Yearly
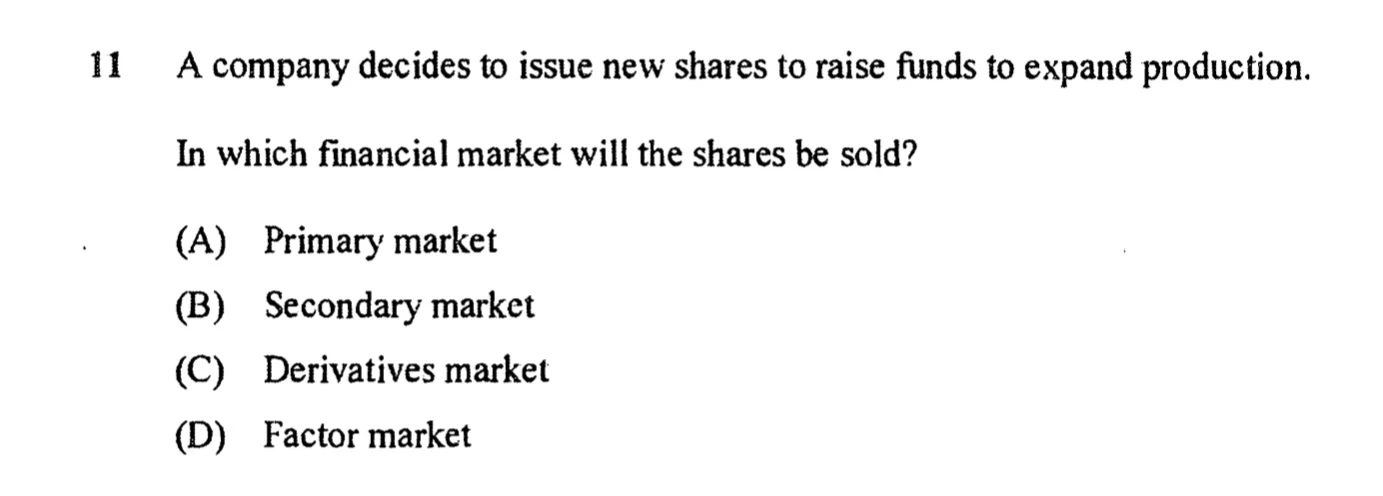
Now let’s talk about different financial markets! We are given a scenario here and have to figure out where in Australia’s financial system it best fits. Defining each financial market would be a good start:
- Primary markets are those where financial securities (e.g. shares) are issued for the first time for capital raising purposes
- Secondary markets are those that involve financial assets that have already been traded in primary markets
- Derivatives markets are were people buy and sell financial assets based on the value of other financial assets
- Factor markets are not exactly a type of financial market. They refer to markets where inputs are bought and sold (e.g. the labour market).
Given the key words in the question, ‘new shares’ and ‘raise funds’, we would be able to place this transaction in the primary financial market.
Thus, the correct answer is (A)
Example Question Three:


2013 Knox Grammar Yearly
This question is a lot simpler as a definitions based one.
- We can even use the key words in the question (‘supervision’) to lead us to the correct regulatory institution (‘The Australian Prudential Regulation Authority’)
Thus, the correct answer is (C)
Topic 6 Government and the Economy
Example Question One:


2008 North Sydney Girls High School Yearly
This one’s a less common exam question, but one that will differentiate you from your peers.
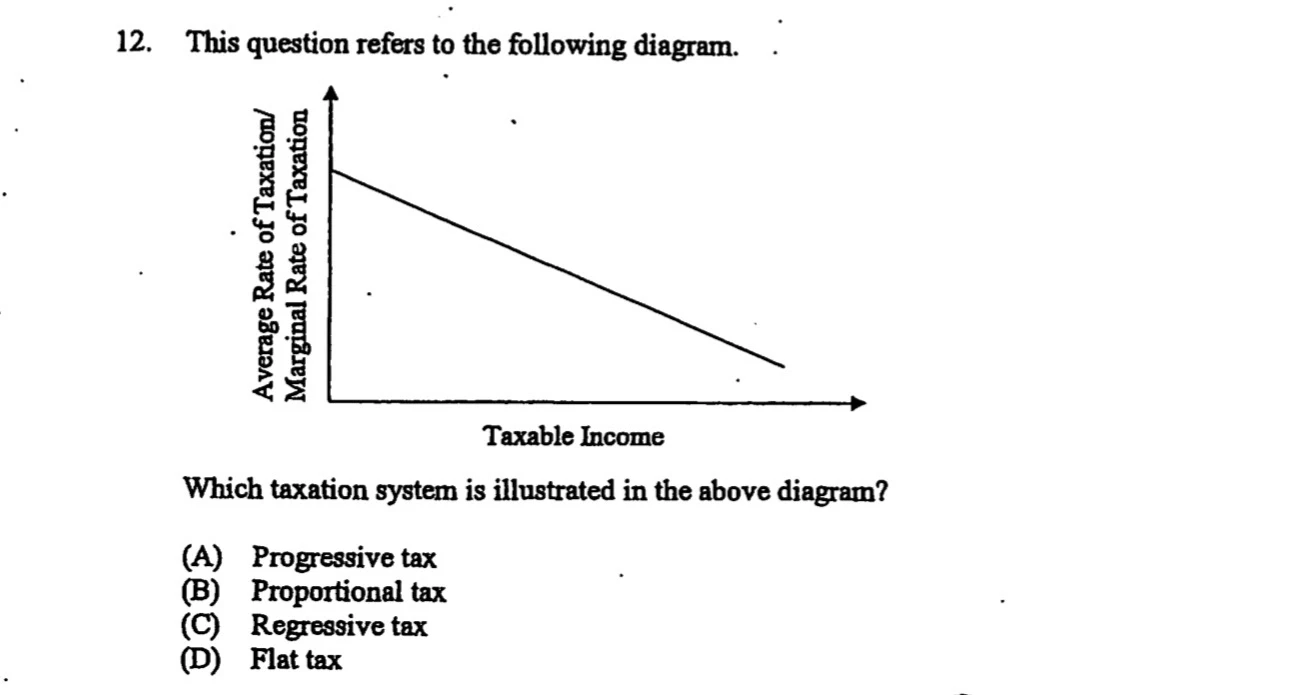
- You need to be able to interpret ANY graph given to you in an MCQ by understanding the x and y axis measurements; in this case taxable income and rate of taxation respectively.
- As taxable income increases (along the x axis), the rate of taxation decreases (along the y axis)
- By definition, this is known as a regressive tax
Thus, the correct answer is (C)
Example Question Two:


2010 North Sydney Girls High Yearly
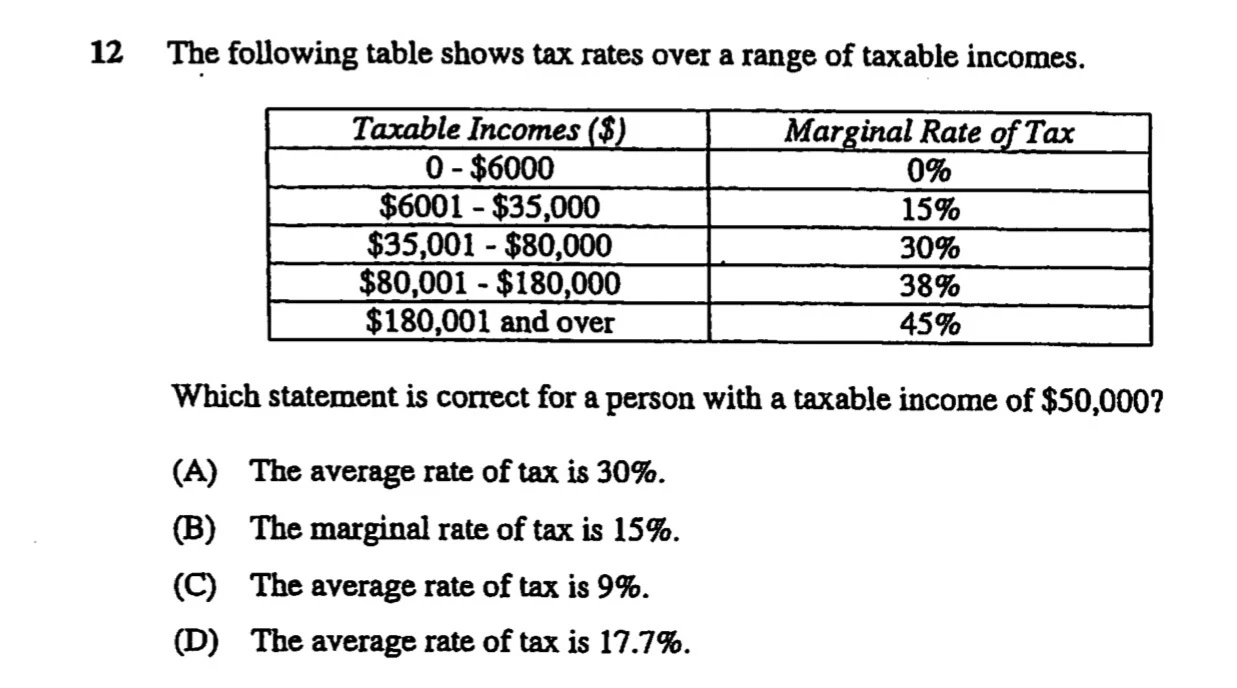
Banking on our knowledge of tax, let’s now focus on different ways of measuring tax rates. For this question, we need the following formula:
Average Rate of Tax (ART) = (Total tax paid/Total taxable income) * 100
We also need to note that the marginal rate of tax is the rate of tax paid for any income earned in that bracket of income. Thus we can to calculate the total tax paid for a $50,000 taxable income as:
Total tax paid = 0%*$6000 + 15%*($35000-$6000) + 30%*($50000-$35000) = $8850
- ‘0%*$6000’ comes from no marginal tax rate (0%) being paid for the first $6000 earnt
- ‘15%*($35000-$6000)’ comes from a marginal tax rate of 15% being paid for any income earned between $6000 and $35000
- ‘30%*($50000-35000)’ comes from a marginal tax rate of 30% being paid for any income earned between $50000 and $35000
Using our original formula, we can now calculate the ART as:
Average Rate of Tax (ART) = (8850/50000)*100=17.7%
Thus, the correct answer is (D)
Example Question Three:


2014 Normanhurst Boys High School Yearly
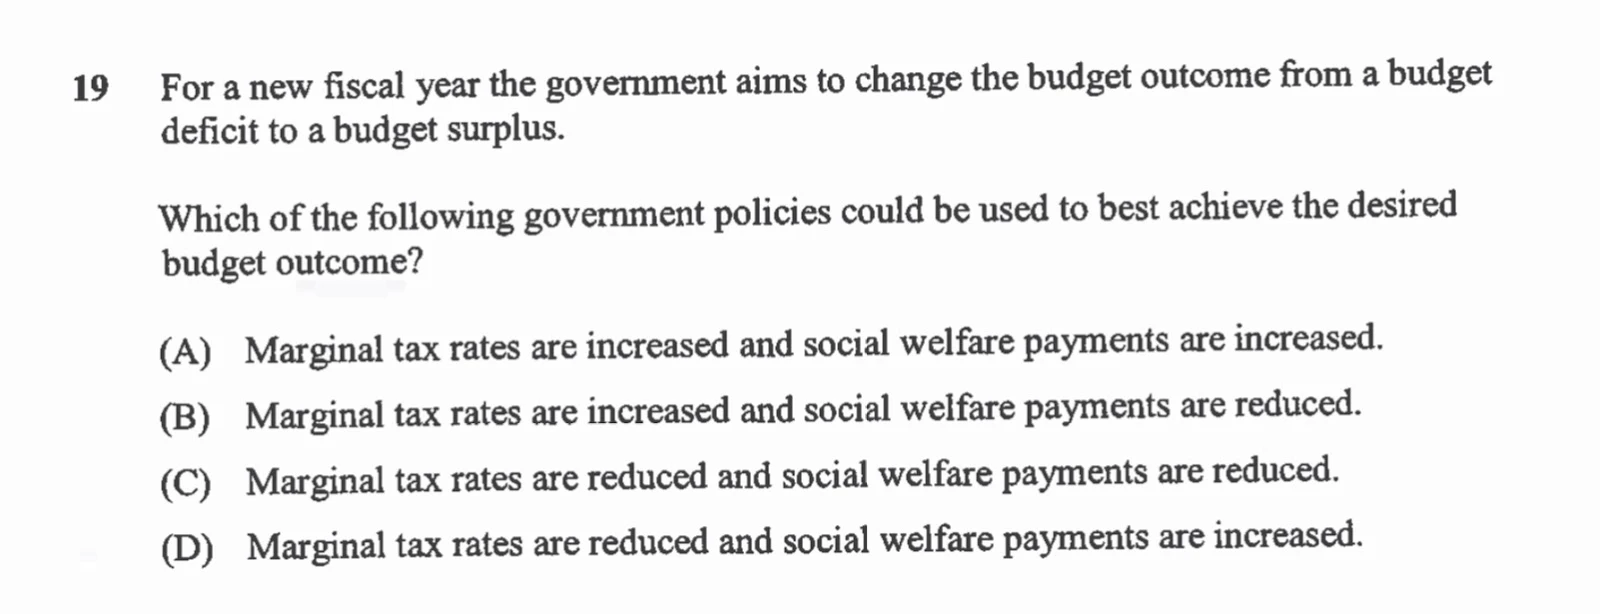
Our final question is related to the budget outcome, which requires knowledge of different outcomes:
- Budget deficit - occurs when government expenditure outweighs government revenue collected (GE > T)
- Budget surplus - occurs when government revenue outweighs government expenditure spent (T > GE)
In this case, we are asked to consider how changes in tax rates and welfare payments will move the budget from a deficit to surplus. We should first note that tax rates will influence government revenue (T), whilst welfare payments will influence government expenditure (GE). This means we need to:
- Increase marginal tax rates, since more income tax revenue (T) will be collected to outweigh expenditure (GE)
- Decrease welfare payments, since expenditure (GE) should fall below government revenue (T)
Thus, the correct answer is (B)
Your Economics Formula Sheet
From the questions we just deconstructed you might’ve realised that there are ALOT of formulas required in preliminary economics. To ensure you don’t lose a single mark in these 1 markers, it’s highly recommended that you make your own formula sheet throughout year 11. Here are some important things to include:
- The Equation - using a different font or style will help you break up your formula sheet better
- Types of Questions - Try to list out the types of questions that can come up when using that formula. This will help you identify the formula required for MCQs a lot quicker in exam situations.
- Question Examples - Make sure to include question type examples and a fully deconstructed answer. You will learn lots of formulae over 9 months, so if you forget one from early on or how to use it, an exemplary answer with an explanation will help you relearn it fast.
Go smash those year 11 economics exams!
Ultimately, your year 11 economics exams aren’t going to be hard if you understand the techniques that can push you to that top band. We hope this gave you a better idea on how to approach the different types of questions in your exams! Good luck for prelims!
If you need any help with economics, come sign up to my classes at Project Academy!
This article is part one of Project Academy’s Year 11 Economics Practice Exam Bank Series.
FAQs
Q: What topics are there in Year 11 Economics?
There are 6 topics in Year 11 Economics, including:
- Introduction to Economics
- Consumers and Business
- Markets
- Labour markets
- Financial markets
- Government and the Economy
Q: Is Year 12 Economics similar to Year 11 Economics?
Similar to most Year 12 courses, HSC Economics builds on the foundational skills and knowledge taught in Year 11. Moving into Year 12, we focus on how the concepts of consumers, businesses, governments, and markets apply to a larger, macroeconomic scale; the Australian Economy & the Global Economy as a whole.
Q: How can I find more practice papers for Year 11 Economics?
To find more practice papers for Year 11 Economics, ask around! Ask your teachers, friends who’ve completed the subject already and friends from other schools. If you’re still looking for practice, Project Academy offers over 300 past papers in addition to homework exam-style questions assigned each week according to the syllabus.
Q: What are the best Economics textbooks?
Most schools will use one of two textbooks, either:
- Tim Riley’s “Year 11 Economics” Textbook
- Tim Dixon’s and John Mahoney’s “The Market Economy” Textbook
In year 12, both publishers produce textbooks as well:
- Tim Riley’s “Year 12 Economics” Textbook
- Tim Dixon’s and John Mahoney’s “Australia in the Global Economy Textbook”
Both textbooks are sufficient, but Riley tends to add extension information and concepts that build upon syllabus content. If you’re looking for something simple, use Dixon.
Q: Overall, is it hard to achieve a Band 6 in HSC Economics?
Year 11 and year 12 Economics can be hard at times, but staying on top of content, theories, policies, and contemporary information is your gateway to doing well.
Of course it isn’t as simple as that when it comes to achieving a band 6. If you want to be in that top band you’ll need to focus on smashing that final exam, section-by-section. If you break down your preparation according to the syllabus (both by content tested and how it can be tested as I’ve done above), you will achieve amazing exam results.


